


Last week I laid out 40 years of financial history comparing long term interest rates with price inflation.
I’d encourage you to stick with this series. I will explain core concepts of money, finance and investing.
A little bit of effort this summer will go a long way towards your financial education.
Converting Rates To Time
Let’s bring back the final chart from last week.
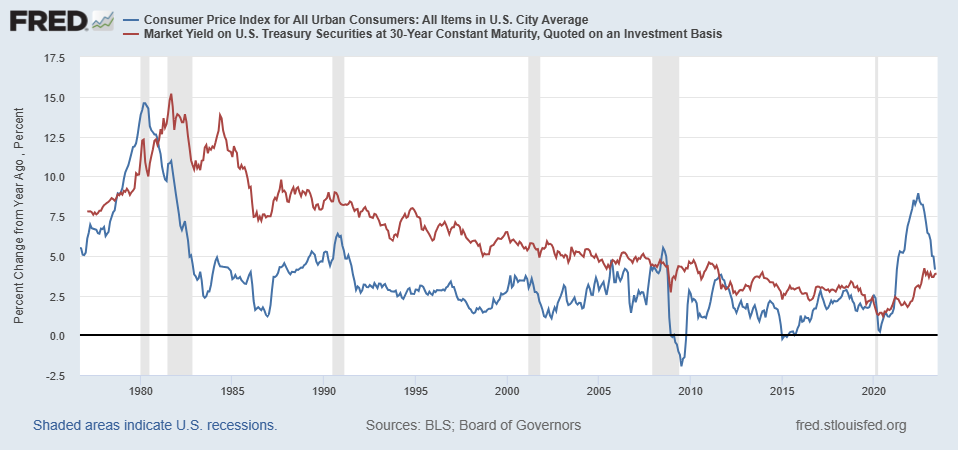
The red line is long term interest rates.
You can see long rates declined from a peak of 15% in the early 1980s to 2% in 2020.
Let me explain what this does to the price of everything, and I mean everything.
If I receive 15% on my cash then I get my money back in 6.7 Years.
If I receive 2% on my cash then I get my money back in 50 years.1
“Years to get my money back” is also called a multiple.
You’ll come across multiples in many situations.
Price Multiples
Earnings Multiples
Net Asset Multiples
Sales Multiples
Cash Flow Multiples
You’ll also come across “cap rates” which is short for capitalization rate.
The “cap rate” is what a buyer applies to cash flow (usually for real estate) to derive the capital value.
For example, if my “cap rate” is 7.5% then my multiple would be the reciprocal of this number [ 1 / 0.075 = 13.3x ].
I would take the income from the investment and multiply it by 13.3 to get an estimate of capital value.
I like to think about multiples in terms of time.
My favorite multiple is Wealth in Time. My article on time is one of the most useful concepts to apply in Family Wealth.
The Decline In The Value Of Money
We’ve grown accustomed to living in a world where money is not particularly valuable.
That probably sounds strange to you.
Consider my two examples:
A lender the early 1980s would have charged up to 18% for a 30-year mortgage.
40 years later, a lender would charge less than 3% for a similar mortgage.
This implies a multiple shift of 5.5x (1 / 0.18) to 33.3x (1 / 0.03).
The price of money is heavily influenced by the amount of money (including credit) that is being created.
We’ve created a lot of money in the last 40 years.
Rates & Multiples
Just like there are many different multiples, there are many different rates used by investors when making decisions.
Short-term interest rates
10-year rates
30-year rates
Mortgage rates (15 year, 30 year, adjustable rate)
Weighted cost of capital
Hurdle rates
Real rates
You’ll read about many different rates.
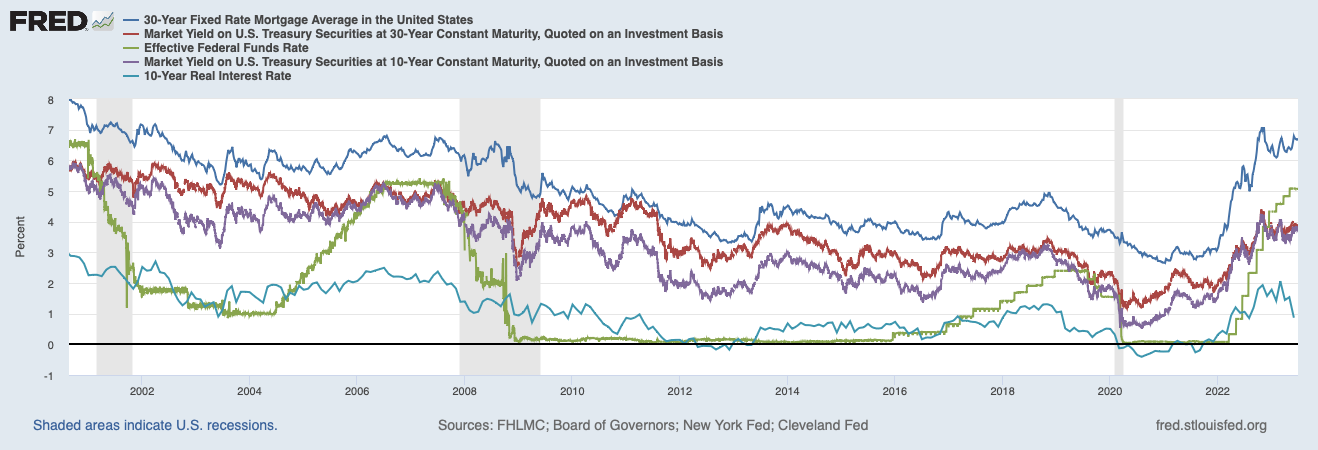
The chart below is a small sample.
It can be confusing.
It doesn’t need to be.
Where To Focus
My recommendation, keep it simple.
I follow three rates.
The US Government’s Long Term Cost To Borrow (30-year rate)
My Long Term Cost To Borrow (30-year mortgage)
My Short Term Yield On Cash
Where I track these rates…
30-Year Federal Rate (slide down the page to see Yield Curve US)
30-Year Mortgage Rate (Mortgage News Daily)
Short Term Federal Money Market Fund (VMFXX)
Those rates are currently:
4% - 30-year treasury rate (Blue Below)
7% - 30-year mortgage rate (Green Below)
5% - Federal money market fund rate (Red Below, approx)
Two years ago the rates were:
2% - annual return from lending to the US Government for 30 (!) years
3% - annual cost to borrow for a home
0% - current yield of cash
Worth pulling these out for you…
Yield On Cash => 0% to 5% in two years
Cost To Borrow => 3% to 7% in two years
Many buyers bought assets…
Assuming capital gains would cover their cash flow shortfall2
Comparing their forecast return to a 0% return on cash
Memory Over Time
Here’s a picture of the last three years, which is about as long as the collective can remember.

The upward moves might not seem like much…
After a 40 year down trend
When they’ve only been in place for ~18 months
When they are small in nominal terms
This is where thinking in multiples helps.
Two years ago the cost to borrow implied a multiple of 33x cash flow (3% mortgage rate)….
Today that has changed to a multiple of 14x cash flow (7% mortgage rate)
A multiple reduction from 33x to 14x.
Asset prices have not changed materially.
Big Picture Thoughts
Here’s what experience has taught me:
Small moves can have large impacts when we think in terms of multiples.
40 years of momentum will not reverse quickly.
We may be at a transitional point, we may not.
If “current” conditions remain the same for 3+ years then the collective will begin to see them as more permanent.
Finally, if you’re an American homeowner then remember… the rest of the financial world is set up differently than a 30-year fixed rate mortgage.
Many US households have been insulated from the move in rates. This is very different than other borrowers. Over time, other loans will be reseting, rolling over and being issued at higher rates.
What does this mean to you, directly?
I’ll share thoughts on that next time.
An important footnote, the money we get back “later” is not the same money. Inflation reduces the purchasing power of money received, later.
I wonder if Airbnb might play the role of “the canary in the coal mine” for the residential sector.